How g_wolf actually trades gold
Seth — @sethortizfx / TradingView SethTrades12 — runs a discretionary Smart-Money-Concepts playbook on a single instrument, wrapped in a mechanical fixed-risk exit engine. Below: what the charts prove, what the 436-signal dataset proves, and a build sheet to replicate it.
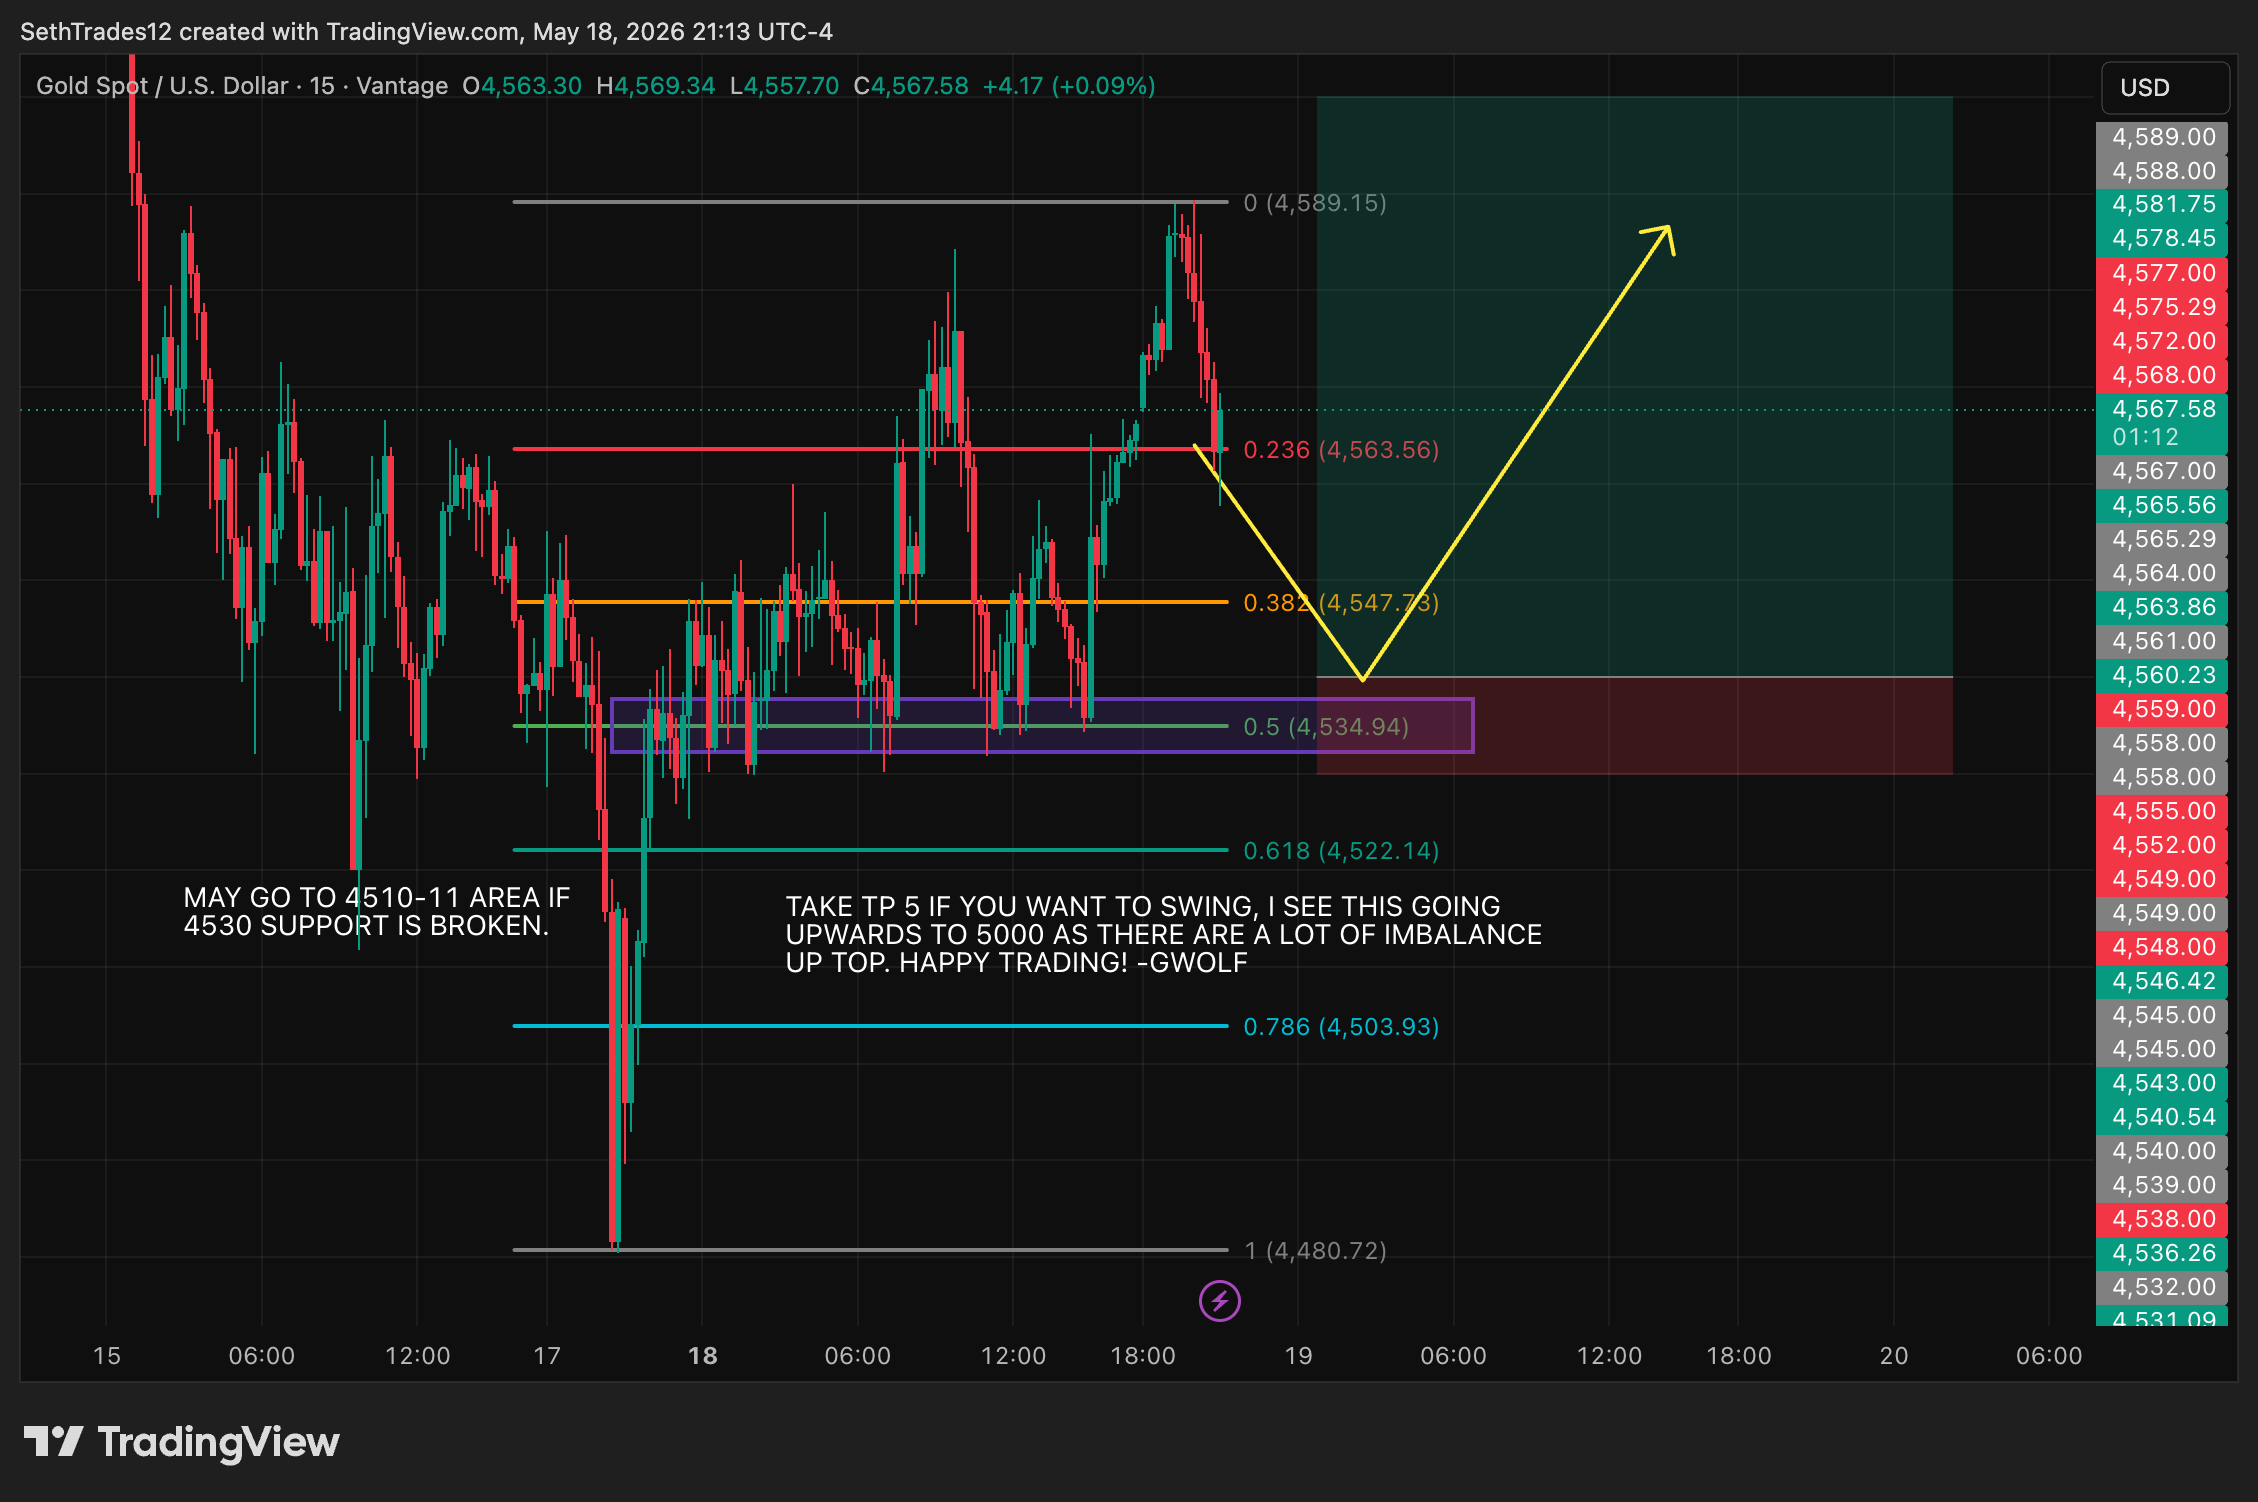
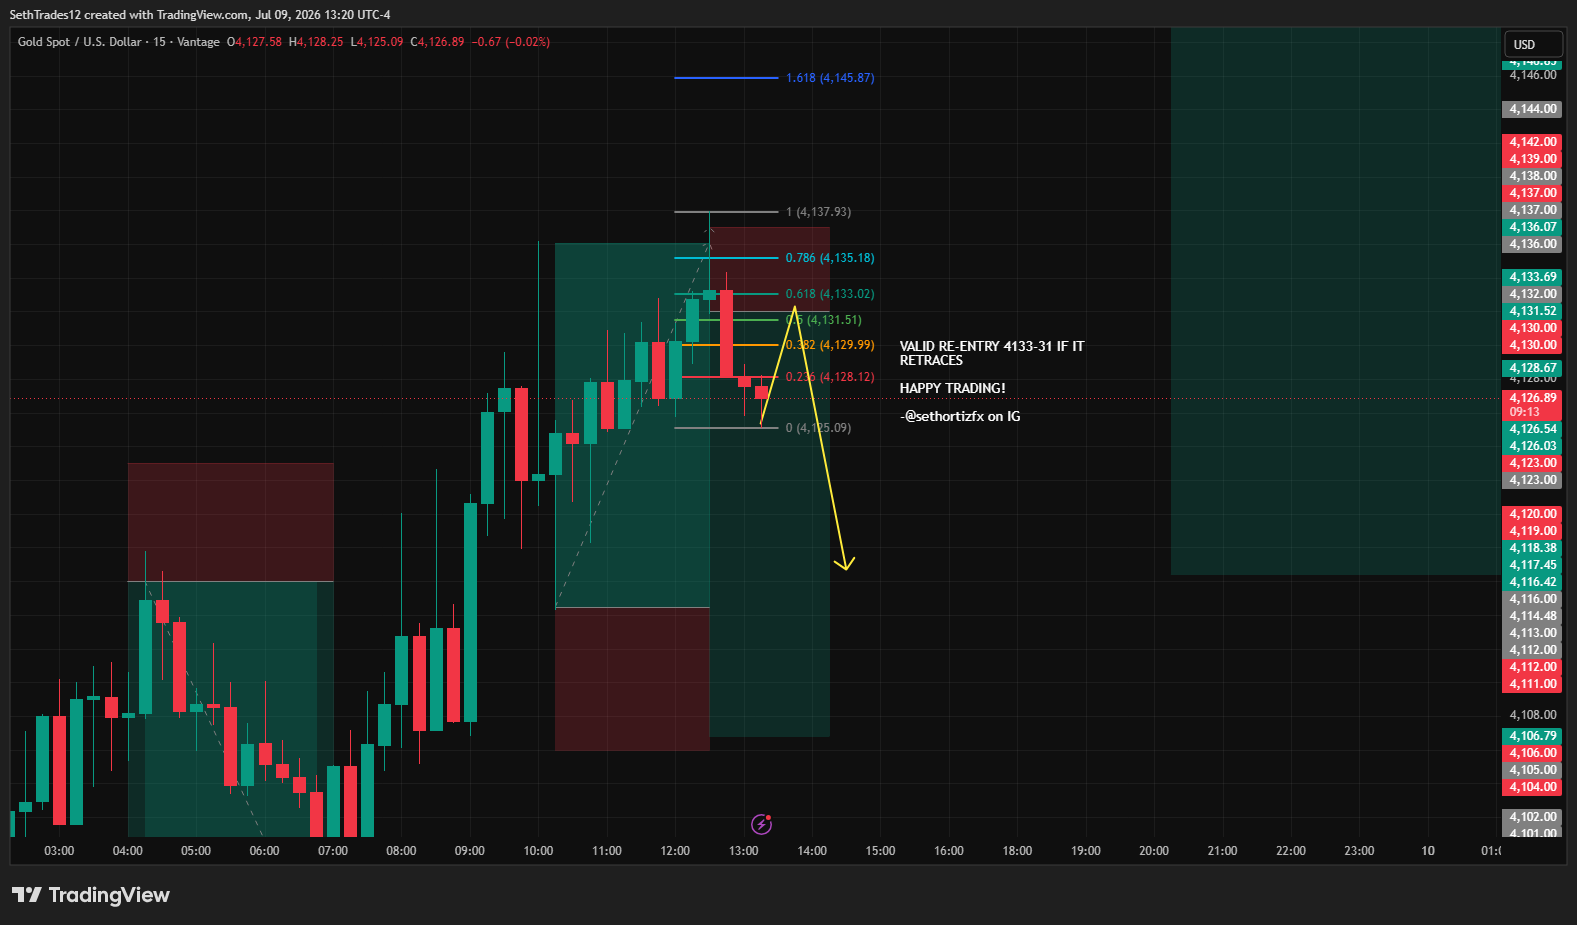
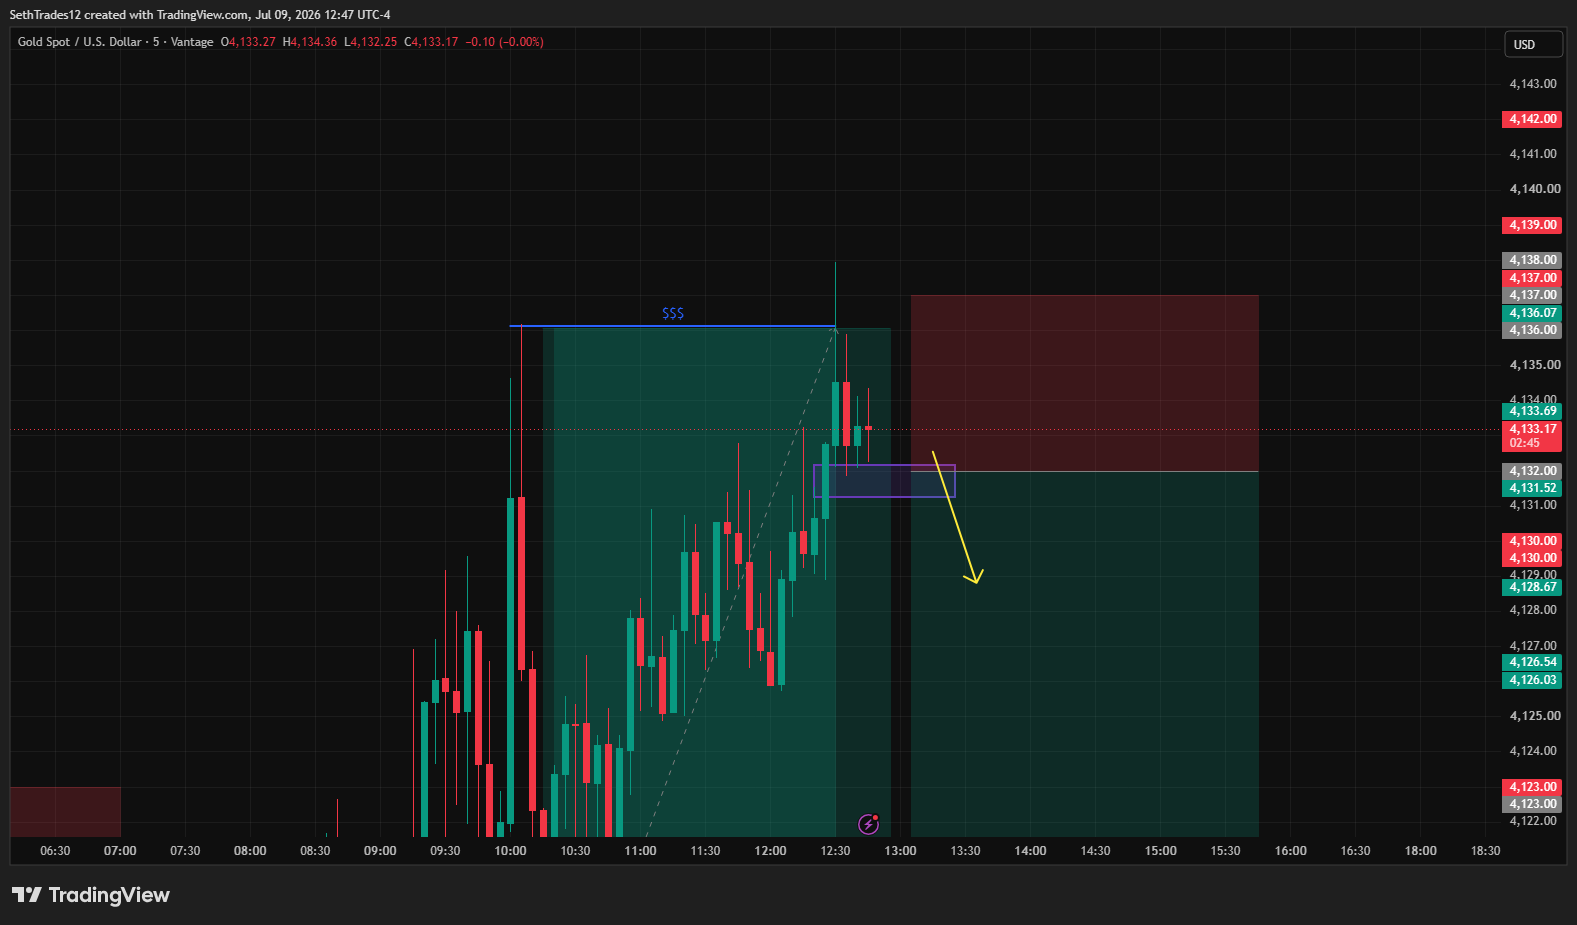
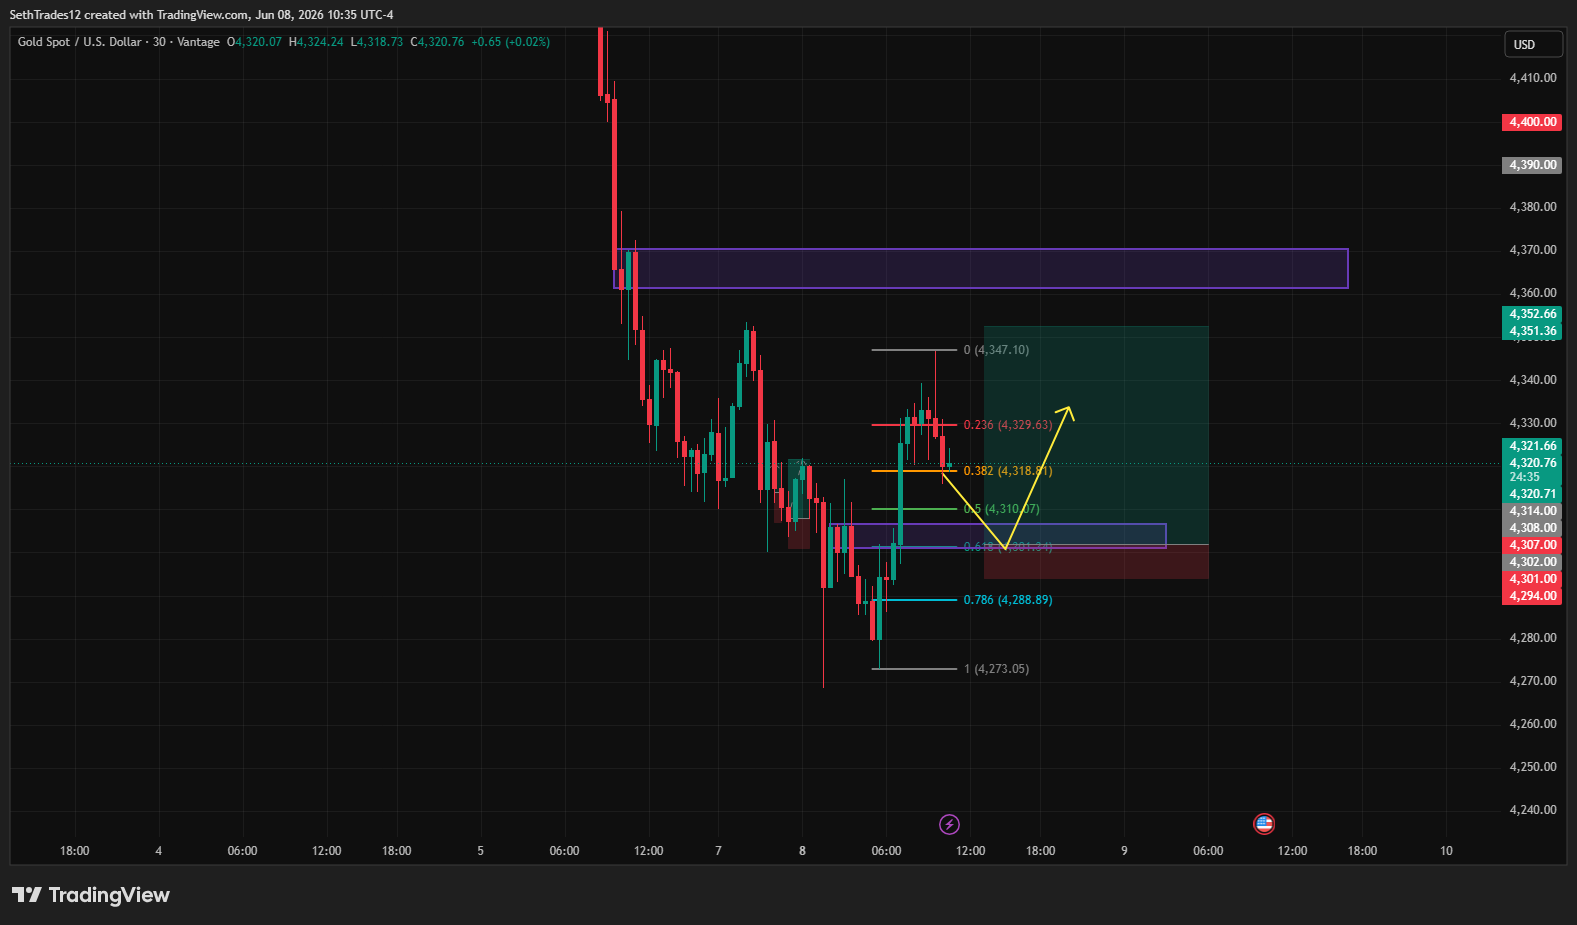
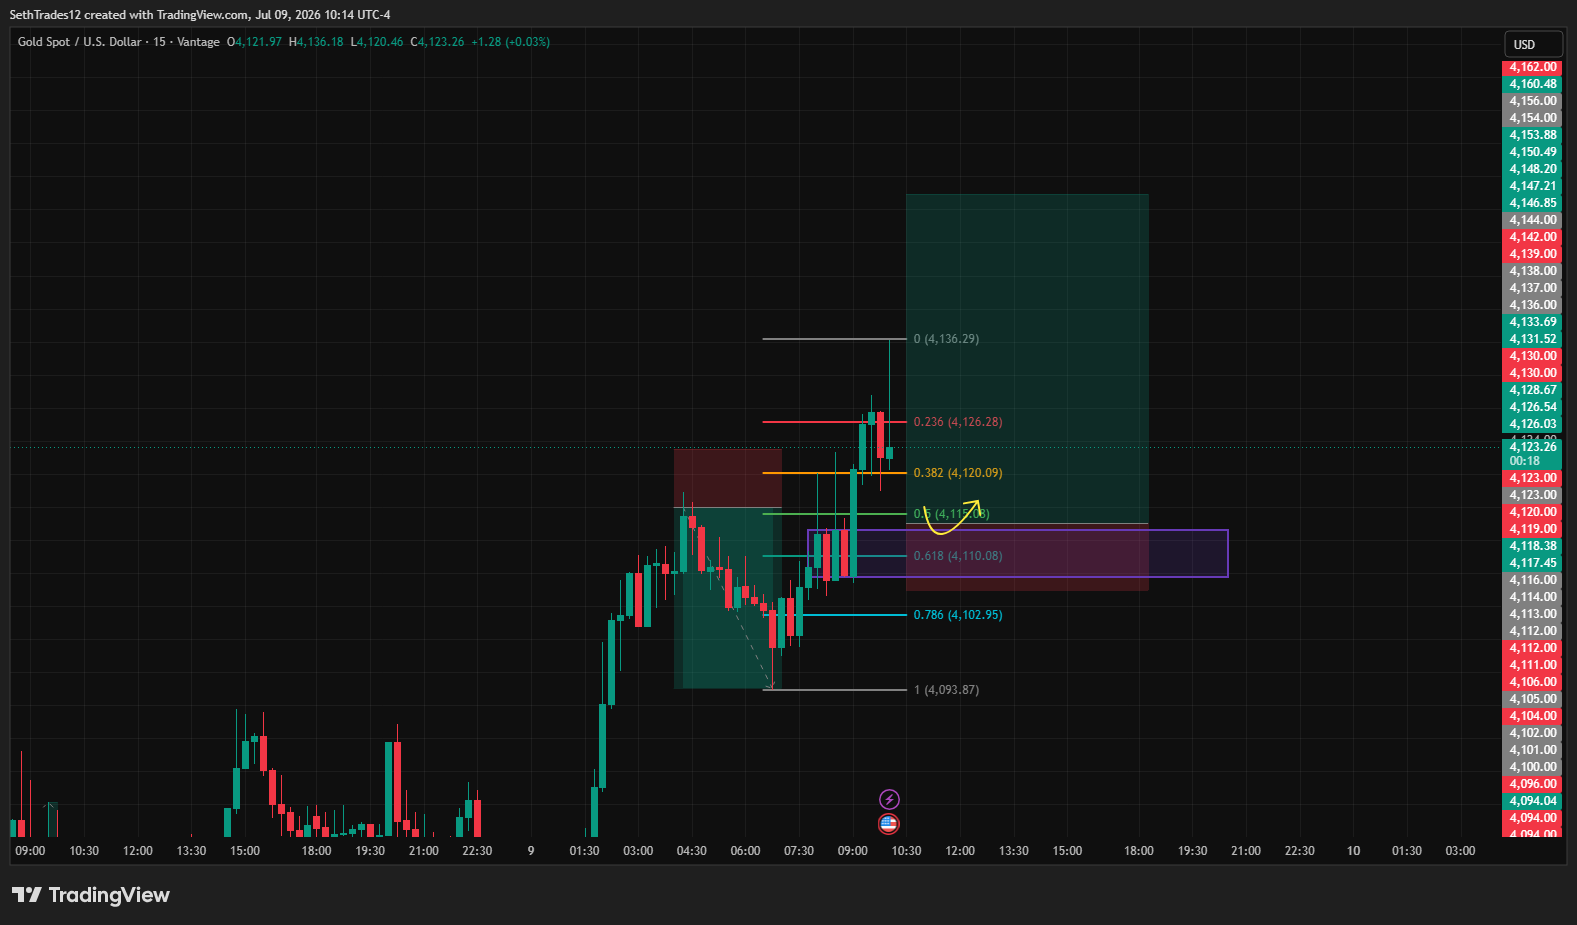
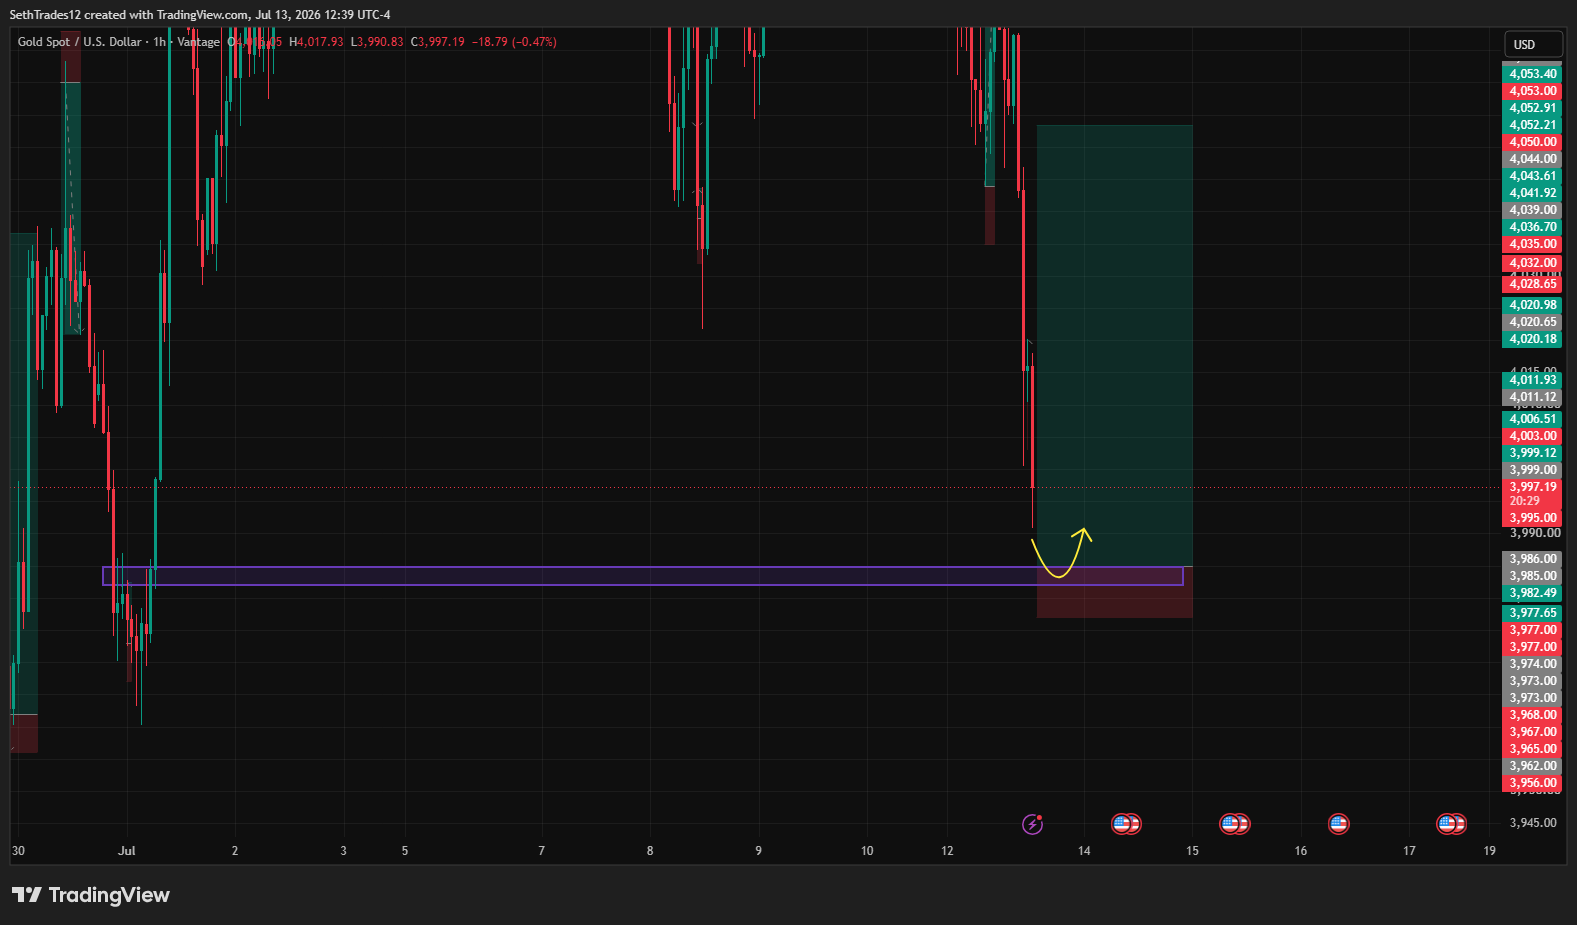
The question was: does he use support/resistance, supply/demand, volume profile, or indicators? We recovered seven of his own annotated TradingView charts. The answer is unambiguous — and there is not a single indicator on any of them.
His own charts
Every snapshot is naked price action on Vantage gold. The right edge is only a price scale — no volume histogram, no VWAP, no oscillator sub-panel. The toolkit repeats on every chart: a rectangle zone, a Fibonacci grid, a position / R:R box, and a projected retrace-then-continue arrow.
The mechanism · 7 parts
A discretionary entry read, bolted onto a mechanical risk-and-exit machine.
One instrument, mastered
Gold and almost nothing else. He knows XAUUSD’s session rhythm, volatility and level structure cold instead of spreading thin.
Zones + Fib + liquidity — not indicators
Entries are reactions to supply/demand order blocks, the 0.5–0.618 fib golden pocket, horizontal S/R, and liquidity sweeps / imbalance (FVG). Zero indicators on any chart.
Fixed-risk engine
Every gold trade risks a near-constant ~$8 (6–11 band), stop placed at a round dollar just past the zone. Constant R is why the equity curve is a straight line and no single loss dents it.
Enter on the retrace into the zone
71% of trades use a fixed $2 entry band (limit orders waiting for price to return into the zone). The rest are market fills when price is already reacting or after a liquidity grab.
Pyramid into momentum
When a zone holds and price runs, he adds more positions in the same direction — each with its own tight stop — rather than fading. This is trend continuation, not mean reversion.
5-target scale-out + manual runner
A laddered exit: bank a fast 0.33R at TP1, ~breakeven the book by TP2, then let a residual run to 2.6R / 5R / 10R. But his single most-used exit is a discretionary manual close into strength.
Session filter + tilt guardrail
Trades cluster in the NY (13–18 UTC) and Asia (00–04) windows and skip the London morning chop. The account even auto-cools-down after two stop-outs in two hours.
Why the data proves the method
Each statistical fingerprint in the 436-signal dataset lines up with a specific SMC behaviour on the charts:
Replication build sheet
The spec to forward-test — not financial advice, a hypothesis to validate.
What to look into next
The discretionary layer — which zone he trusts and when he closes the runner — is the part the dataset can’t fully expose. To close the gap:
- 01Build our own gold history. The platform only serves ~2 days of candles. Pull full 5m/15m/1h XAUUSD (Dukascopy / MetaApi) and align all 436 entries to prove zone-touch and fib-level hit rates.
- 02Quantify the manual-close rule. 167W/2L is the real alpha. Correlate close timestamps vs price to find the exhaustion trigger (candles-in-trade, % of TP5, reaction at next zone).
- 03News overlap. NY 13:30–15:00 UTC = US data / equity open. Tag entries against the economic calendar — is he trading the reaction or avoiding the release?
- 04Pyramid risk cap. Does stacking 3–4 positions mean 3–4R of live exposure, or is total risk capped? This decides the real drawdown profile.
- 05Fill realism. Backtest with true Vantage spread + slippage; the API tracks slippage_pts. Copying market entries in fast NY moves is where edge leaks.
- 06Benchmark the house. Sample the other 10 providers (Fxedge 547 signals, kingfkg 352) — is the zone+fib style g_wolf’s own, or the platform’s trained template?
- 07Follow the source. @sethortizfx (IG) and SethTrades12 (TradingView) publish live reads — cross-reference his public calls against the signal log for entry-logic ground truth.